
When freelance science journalist Tara Haelle first started writing about medical studies, she admits she had no clue what she was doing. She quoted press releases and read only study abstracts—practices that make most science journalists cringe. But in the spring of 2012, Haelle attended a workshop run by health journalism veterans Gary Schwitzer and Ivan Oransky at the annual conference of the Association of Health Care Journalists (AHCJ) in Atlanta. The two watchdog powerhouses—Schwitzer spearheads Health News Review and Oransky, Retraction Watch—taught Haelle and the other attendees how to catch flaws in research studies. Haelle came away from the session a new journalist. “I was like, ‘Holy crap, I’ve been doing it wrong,’” she says.
For years after the workshop, Haelle put those new skills into practice, poring over research studies for hours and delving deep into the thicket of their methods and results sections. Now the AHCJ Medical Studies Core Topic leader, she regularly takes down overblown or shoddy science. Some of the issues Haelle calls out involve questionable practices like excessive data mining or cherry-picking subjects—activities that likely reflect increasing pressure on scientists to produce eye-catching results.
The problem, according to Haelle and others, is that this statistical fudging has grown harder to detect. Much of it is buried in the way data are sliced and diced after the fact or put through tortured analysis in a search for significant results. The good news is that science journalists can learn to catch many of these tricks without getting a degree in biostatistics, Haelle says. “You don’t have to be able to conduct your own regression analysis to be able to look for problems.”
As journalists comb through a study’s nuts and bolts—avoiding the temptation to skim through the dense prose of the methods and results sections—they should also look out for specific red flags.
Data Dredging
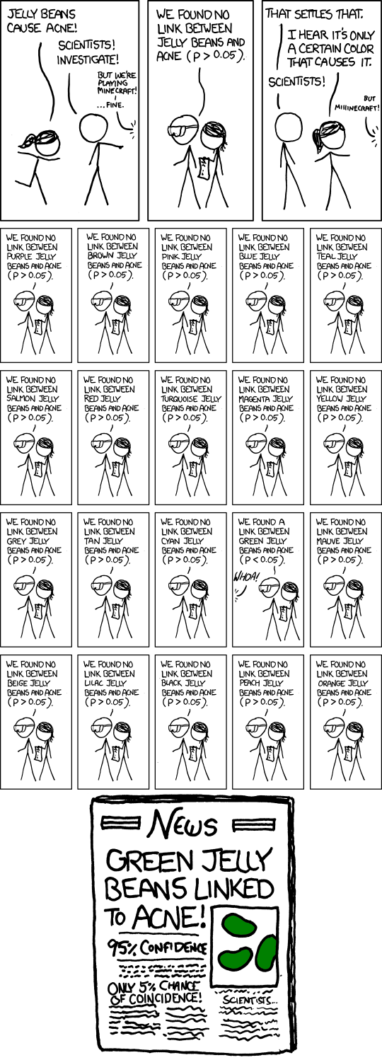
One of the more common ways researchers might try to tweak their results is by a practice known as p-hacking, which entails mining a dataset until you get a finding that passes the bar of statistical significance. This is determined by a p-value—a measure of how unexpected a finding is, if in fact a researcher’s hypothesis was wrong. (Most scientific fields consider a p-value of less than .05 statistically significant.)
P-hacking takes advantage of the flexibility researchers have to massage their data after it has already been collected, according to biostatistician Susan Wei at the University of Minnesota. In most research studies, researchers must make judgment calls about which of several analytical approaches to use, says Wei. She notes that you could give the same dataset to five statisticians, and each would come up with a different result. “Data analysis is not quite a science,” she says. “There’s a bit more art to it.”
P-hacking can take a few different forms, Wei says. In some cases, researchers might test for relationships between a bunch of variables—say, between different doses of an antidepressant and their effects on a variety of different outcomes, such as mood, appetite, sleep patterns, or suicidal thoughts. If a significant result pops out for any of those outcomes, the researchers may then generate a hypothesis to fit that finding, ignoring those variables for which there was no effect. Coming up with a hypothesis retroactively—sometimes referred to as “hypothesizing after the results are known,” or HARKing—often follows this form of p-hacking.
Another way researchers can p-hack data is to stick with their original hypothesis for a study, but cycle through several statistical tests until they achieve the result they were hoping to find. For example, if a study includes patients’ ages as a variable, researchers could first use a statistical technique that treats age as a continuum. If this approach doesn’t produce a significant finding, they could try a different analysis that breaks the ages into categories, such as people younger than 50 and those who are 50 and older.
Both of these tricks increase the likelihood that a significant result is actually just due to plain chance. Since researchers typically consider p-values less than .05 statistically significant, running 20 or more tests almost ensures that at least one finding is a false positive. As a result, researchers may be drawing connections that don’t actually exist. In a March 2017 blog post for AHCJ, Haelle pointed out p-hacking in a study that found an association between certain vaccines and psychiatric conditions, including obsessive compulsive disorder and anorexia. As Haelle noted, the researchers ran an enormous number of tests based on different combinations of vaccines, administration time points, and psychiatric conditions, making it nearly inevitable that some significant result would arise by chance alone.
Spotting p-hacking can be difficult, Wei says, because researchers may sanitize their final publications by only reporting the tests that produced significant findings. But reporters can look for evidence that it might have occurred by asking researchers if they examined other variables or used extra statistical tests that weren’t listed in the paper—and if so, ask how they settled on the published ones.
The methods and results sections of studies can reveal other signs of p-hacking. For example, Haelle says, watch out for an excessive number of endpoints, otherwise known as dependent variables. Clinical studies should generally have one or two primary endpoints and maybe four to six secondary ones. Much more than that—even if all the endpoints are reported—signals that the researchers might have gone fishing for a statistically significant result. Haelle also scans papers for mentions of a Bonferroni correction, which is one of a few ways to account for a large number of statistical tests or endpoints. If she doesn’t find a correction when she thinks one was warranted, she asks the researchers why, or if they accounted for multiple tests with a different technique.
Also, examine the published p-values themselves. If they all tend to land near .05, that’s a sign that p-hacking might be in play, says Brian Nosek, a psychologist at the University of Virginia and executive director of the Center for Open Science, which encourages transparency in science. P-hacking practices tend to nudge non-significant p-values to just under .05. Highly significant findings, such as those with p-values less than .01, are less likely to have arisen from p-hacking.
To verify that a medical study hasn’t been p-hacked, check its registration on ClinicalTrials.gov. In most study records, researchers specify the endpoints they intend to use before a project begins. The tabular view of a record lists both the current and original endpoints, as well as a link to older versions of the same study. Researchers can also opt to preregister studies in any field at the Center for Open Science’s Open Science Framework, where they can submit detailed plans for data collection and analysis up front. Some 7,000 studies are now preregistered on the site, Nosek says.
These public records allow journalists to compare the original plan for a study to the published paper. Discrepancies are surprisingly common, according to the results of a project run by Ben Goldacre, senior clinical research fellow at the Centre for Evidence-Based Medicine at the University of Oxford in England. Goldacre and his team checked the reported outcomes of clinical trials published in five top medical journals from October 2015 to January 2016 against their initial protocols or public registries. Looking at 67 trials, they found that on average, each reported only around 58 percent of its original outcomes in the published paper and added about five new outcomes.
Lastly, p-hacking may deliver findings that, while statistically significant, aren’t that meaningful or of much practical use. What’s more, p-values in general aren’t even designed to gauge the strength or importance of a finding. Instead look at effect sizes, says Regina Nuzzo, a freelance journalist and statistics professor at Gallaudet University in Washington, DC. Effect sizes can show how different two groups are, for example, instead of just reporting that there is a difference.
To find information about effect sizes within studies, search for keywords like “Cohen’s d” or “r-squared,” which are standard measures of effect size. And ask researchers to interpret their effect sizes in the context of the real world—for example, how much a drug actually helps people with chronic obstructive pulmonary disease.
If an effect size is very small or missing from the results altogether, that’s a warning sign that needs following up, Nuzzo says.
Taking an Early Peek
In a practice called data peeking, or interim analysis, researchers may analyze some of their data before it’s all collected. Doing so may help a scientist get an early look at whether a drug is working, for example, but it’s a bad idea statistically, says Nosek. Running some initial tests on data and then again at the end of a study carries the same pitfalls as p-hacking, he says, because the data undergoes multiple rounds of statistical tests.
Data peeking is hard to detect, unless a study was preregistered, because researchers rarely disclose it, Nosek says. However, checking the results of a study early may motivate a scientist to switch out endpoints or even adjust an intervention midstream. Tweaking an intervention before a study ends is especially tricky, says Wei, because when that occurs, it’s impossible to say whether the intervention being tested really worked, or if the changes themselves nudged the results toward significance.
And if a study is halted after interim analyses—for example, a drug trial is stopped early due to safety concerns—remember that the findings are less reliable, says Lisa Schwartz, a professor of medicine at the Dartmouth Institute for Health Policy and Clinical Practice in New Hampshire. Researchers may even end trials early if a drug or therapy seems to be overwhelmingly beneficial. But treatment effects can vary over time, Schwartz says, so what seems like a positive finding at the time of data peeking could level out by the end of a study.
If a published paper lists analyses that were run before all of the data were collected, Schwartz advises that journalists ask researchers if these early checks were pre-planned in the study’s original protocol. (Sometimes this is part of quality control.) “The answers to that question start to help you gauge your level of worry about whether this is really something that is in the suspect-science category,” she says.
Slicing and Dicing
When statistical analyses based on an entire dataset don’t pan out, researchers may choose to cut out a part of the data for a separate analysis. Perhaps a treatment only benefits women, or maybe a drug is most effective in children younger than a certain age. Analyzing a subgroup of collected data is a very common practice, especially in the context of clinical trials, where drugs are rarely panaceas, says Wei. But this practice is not without downsides. “Subgroup analysis has always been rather controversial,” she says, even though almost everyone does it.
The problem with looking at a subset of data is that the results from these analyses are often not reproducible, Wei says. In other words: If a subgroup of patients seems to be particularly responsive to a drug, researchers should then verify the result by conducting a whole new study using only people with the characteristics of the original subgroup. But chances are that this follow-up study won’t come up with the same findings. This may happen if the number of participants in the initial subgroup is small, making the results less reliable. Findings that turn out to be significant are likely just false positives. For example, a 2011 study of the fragile X drug mavoglurant showed benefits for a subgroup of seven people with the autism-related condition who had a specific genetic profile. But subsequent studies of the drug didn’t reveal the same results.
However, if the original study contained a large number of participants, subgroup analyses might signal a real result. For instance, when researchers broke down data—by age and time since menopause—from over 27,000 postmenopausal women participating in two large Women’s Health Initiative trials, they found that hormone replacement therapy can have dramatically different effects and risks. Younger women in the early stages of menopause may be able to take hormones to relieve symptoms like hot flashes, but older women using the therapy long-term have a higher risk of breast cancer and other illnesses.
Beware of “just-so stories,” says Aschwanden. “These stories perfectly match the data because they were created for the data.”
When reading research articles, it’s usually easy to see when scientists have pulled out a chunk of their data for a closer look, Haelle says. For example, after listing the results for the full dataset, a paper may include findings based on subsets of the data, such as participants of a certain gender or race. In those cases, probe further, and ask whether the subgroup being tested makes logical sense considering what’s being studied.
Christie Aschwanden, lead science writer at FiveThirtyEight, cautions that reporters should be careful of “just-so stories” (alluding to Rudyard Kipling’s collection of fantastical stories about how certain phenomena came to be). Scientists may craft a narrative to justify testing a subgroup after they find that it produced a significant result. “These stories perfectly match the data because they were created for the data,” she says.
Also, keep in mind that researchers might test several smaller portions of their data until they see a positive effect, which is a form of p-hacking, Wei says. “You’re fishing until you catch a fish,” she says. “Of course you’re always going to catch one if you keep going.” This helpful Health News Review story provides additional reasons to approach studies with subgroup analyses cautiously.
Journalists should be particularly wary of studies that test a slew of subgroups of people with specific genetic characteristics, says Dartmouth’s Schwartz. Projects like these often have large datasets, which means researchers can test an immense number of correlations between different genetic traits and diagnoses. These studies and other types of subgroup analyses are important for screening ideas, Schwartz says: They help scientists formulate hypotheses for future studies. But they do not offer a reliable result by themselves.
Picking a Proxy
Researchers also have flexibility in choosing their study’s endpoints, some of which are more useful than others. When studying a drug designed to prevent heart attacks, for example, a scientist may measure blood pressure or cholesterol as a proxy for the number of heart attacks that the drug purportedly prevents. These so-called surrogate endpoints save time and money when other variables, like deaths, could take many years and millions of dollars to measure. This is mostly a legitimate practice, Wei says, since there are typically scientific standards for what makes an endpoint a good proxy to use.
Keep in mind that researchers could be reporting a surrogate endpoint simply because it revealed a significant finding, when other more meaningful endpoints did not.
Some surrogate endpoints are even accepted by the U.S. Food and Drug Administration as grounds for drug approval, says Schwartz. Still, read these with caution. For instance, researchers have tested diabetes drugs by measuring changes in average blood sugar levels, instead of more direct measures of patient well-being. But issues with the drug Avandia called the use of this marker into question. Even though their average blood sugar decreased, people taking the diabetes drug had an increased risk of heart attacks and other cardiovascular complications.
“Surrogates always introduce [a] leap of faith,” says Schwartz. You hope they translate into outcomes that make a difference in people’s lives, but it’s not a guarantee. This is why studies using surrogate outcomes deserve a wary eye.
The use of biomarkers in psychology research is another example of potentially flimsy surrogates, says Haelle. For instance, she notes, researchers may measure certain types of brain activity as an endpoint in a drug study involving people with schizophrenia. But these measures aren’t yet reliable as markers of actual treatment response. Keep in mind that researchers could be reporting a surrogate endpoint simply because it revealed a significant finding, when other more meaningful endpoints did not. Measures of quality of life are examples of endpoints that may better mark a patient’s overall outcome.
Additionally, researchers may roll several endpoints into one composite outcome, which allows them to test different combinations of endpoints—number of heart attacks, hospital admissions, and deaths, for example—until something turns up significant. But these results are vague when it comes to interpreting how a treatment may actually improve patients’ lives. For that reason, journalists should check the validity of surrogate outcomes with outside sources. Haelle notes that scientists who are also practicing physicians are especially helpful, because they understand the importance of measuring outcomes that are meaningful to patients.
Don’t Go It Alone
With enough practice, journalists can learn to spot some instances of p-hacking or other statistical sketchiness. But for many research articles, wading through the statistical morass is not easy. “This is a big ask for journalists to be able to identify these things,” says Nosek. After all, if a questionable act made it into a publication, that means it got by the other researchers and journal editors who reviewed the paper. Thus, it’s smart reporting—not a failure—to reach out for help when you need it.
A few organizations provide resources to help journalists brush up on common statistical errors and sketchy tactics. Health News Review publishes a toolkit of tips for analyzing studies, such as what it really means (and doesn’t) if a finding is statistically significant. The AHCJ has several tip sheets on covering medical studies. (Some are available only to members of AHCJ.) The association also has related sessions, like the one Haelle attended and now helps run, at its annual conference, as well as at regional workshops across the country.
Don’t assume that the appearance of shady statistics in a paper makes the researcher an outright fraud. Generally, scientists are motivated to discover truth and find good evidence to back it up.
Science journalists should also develop relationships with experts who can help decipher the complex methods and results of papers. “Make friends with a statistician, buy them some beers, and put their number on speed dial,” says Nuzzo. Additionally, the resource STATS.org aims to improve statistical literacy through workshops at news organizations and through its STATScheck service, which journalists can use to submit questions to statisticians, including Nuzzo. Reporters can also reach out to the American Statistical Association, which can identify statisticians who are familiar with the particular field a journalist is covering. For example, the association helped Aschwanden connect with an expert who could help her understand the complicated methods of cloud seeding for a story she was working on.
In the end, journalists should be careful not to assume that the appearance of shady statistics in a paper makes the researcher an outright fraud. Generally, scientists are motivated to discover truth and find good evidence to back it up. “Mostly the questionable research practices are done out of ignorance, not out of deliberate intent to deceive,” says Nosek.
Part of the reason problems like p-hacking and data peeking have arisen, Wei says, is that traditional statistical techniques are no longer relevant for increasingly complex study designs. “We’re aware of the issues,” she says. “We’re trying to give scientists tools to do more rigorous science, which hopefully leads to better reproducibility.”
As Aschwanden made clear in her recent award-winning FiveThirtyEight feature “Science Isn’t Broken,” science is messy—and just plain hard. And scientists themselves aren’t perfect. Just like anyone else, she notes, they are susceptible to the natural bias that drives us to think we’re doing good work even when we aren’t. “Of course a researcher is going to have a tendency to want to overplay their findings,” she says. “This is a human impulse, and it takes work to overcome this.” And that work doesn’t stop with scientists—it also extends to the journalists who cover science.

Rachel Zamzow is a TON fellow sponsored by the Burroughs Wellcome Fund. She is a freelance science writer based in Waco, Texas. The brain is what makes her tick, so most of her stories have a psychology or neuroscience slant. But she’s always interested in anything new and exciting science has to offer. She’s written for a variety of publications, including the award-winning autism research news site Spectrum and The Philadelphia Inquirer, where she was a 2014 AAAS Mass Media Fellow. She tweets @RachelZamzow.