What questions do we ask of data sources, and how do we answer these questions? In a recent TON feature, “Interrogating Data: A Science Writer’s Guide to Data Journalism,” journalist Betsy Ladyzhets laid the groundwork for science writers to use data in their work. Data is a source that must be interrogated, just as a reporter would delve into the details of a new paper or question a scientist about their research.
Ladyzhets’s feature outlines three primary stages of a data journalism project. First, a reporter finds a dataset to analyze. This can be the results of a scientific paper, a government report, or a slice of a large data repository, such as the World Health Organization’s Global Health Observatory.
Next, the reporter analyzes this dataset by looking closely at different variables, filtering, doing calculations, making charts, and interrogating the methodology which went into compiling the dataset itself.
Finally, the reporter presents the results of the analysis to readers. Presentation may range from including specific summary figures in a story to allowing readers to explore a dataset themselves through an interactive visualization.
The data analysis stage of data journalism is the most intimidating for many writers new to this field, as this is the stage in which veteran data journalists often use coding or at least a well-oiled spreadsheet. But it is possible for anyone to practice the basics without advanced computing skills. More than knowledge of any particular computing language, data analysis requires the ability to ask concrete, specific questions, then home in on what information will be necessary to answer those questions.
To help readers get started, Ladyzhets and The Open Notebook have collaborated with Workbench, a free web application developed at the Columbia Journalism School, to develop two science-data tutorials. Workbench allows journalists to perform many of the steps of a simple data project—retrieving data, cleaning it, analyzing it, presenting it—without any coding. You can make a free account and begin to create “workflows,” or projects, and can access the platform’s free introductory lessons.
These lessons now include two tutorials that science writers can use to explore the kinds of datasets that they might encounter in their reporting. Both tutorials strip away from the first and third stages of a data journalism project to focus on the analysis stage. Users are given sample datasets from public scientific sources and led through the process of narrowing down their focus to a specific variable, then filtering the data to answer a question.
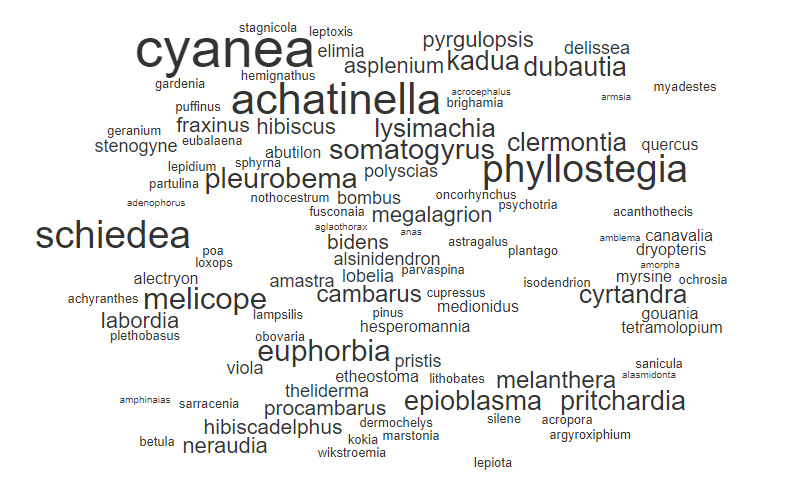
- Tutorial 1 (easy) asks: What are the most common groups of critically endangered species in the U.S.? We answer this question using data from the International Union for Conservation of Nature (IUCN) Red List.
- Tutorial 2 (intermediate) asks: Which American cities have high particle pollution levels? We answer this question using data from the Environmental Protection Agency (EPA) to identify cities with air pollution levels above federal standards.
For more advice on data journalism and resources that you can use to practice your burgeoning skills, see Ladyzhets’s “Interrogating Data” feature.

Betsy Ladyzhets is a data journalist and science writer based in Brooklyn, New York. She is a research associate at Stacker, where she manages the publication’s Science and Lifestyle verticals. She’s also a member of the National Association of Science Writers and a volunteer for the COVID Tracking Project. Find her on Twitter @betsyladyzhets, and check out her newly minted newsletter, the COVID-19 Data Dispatch.