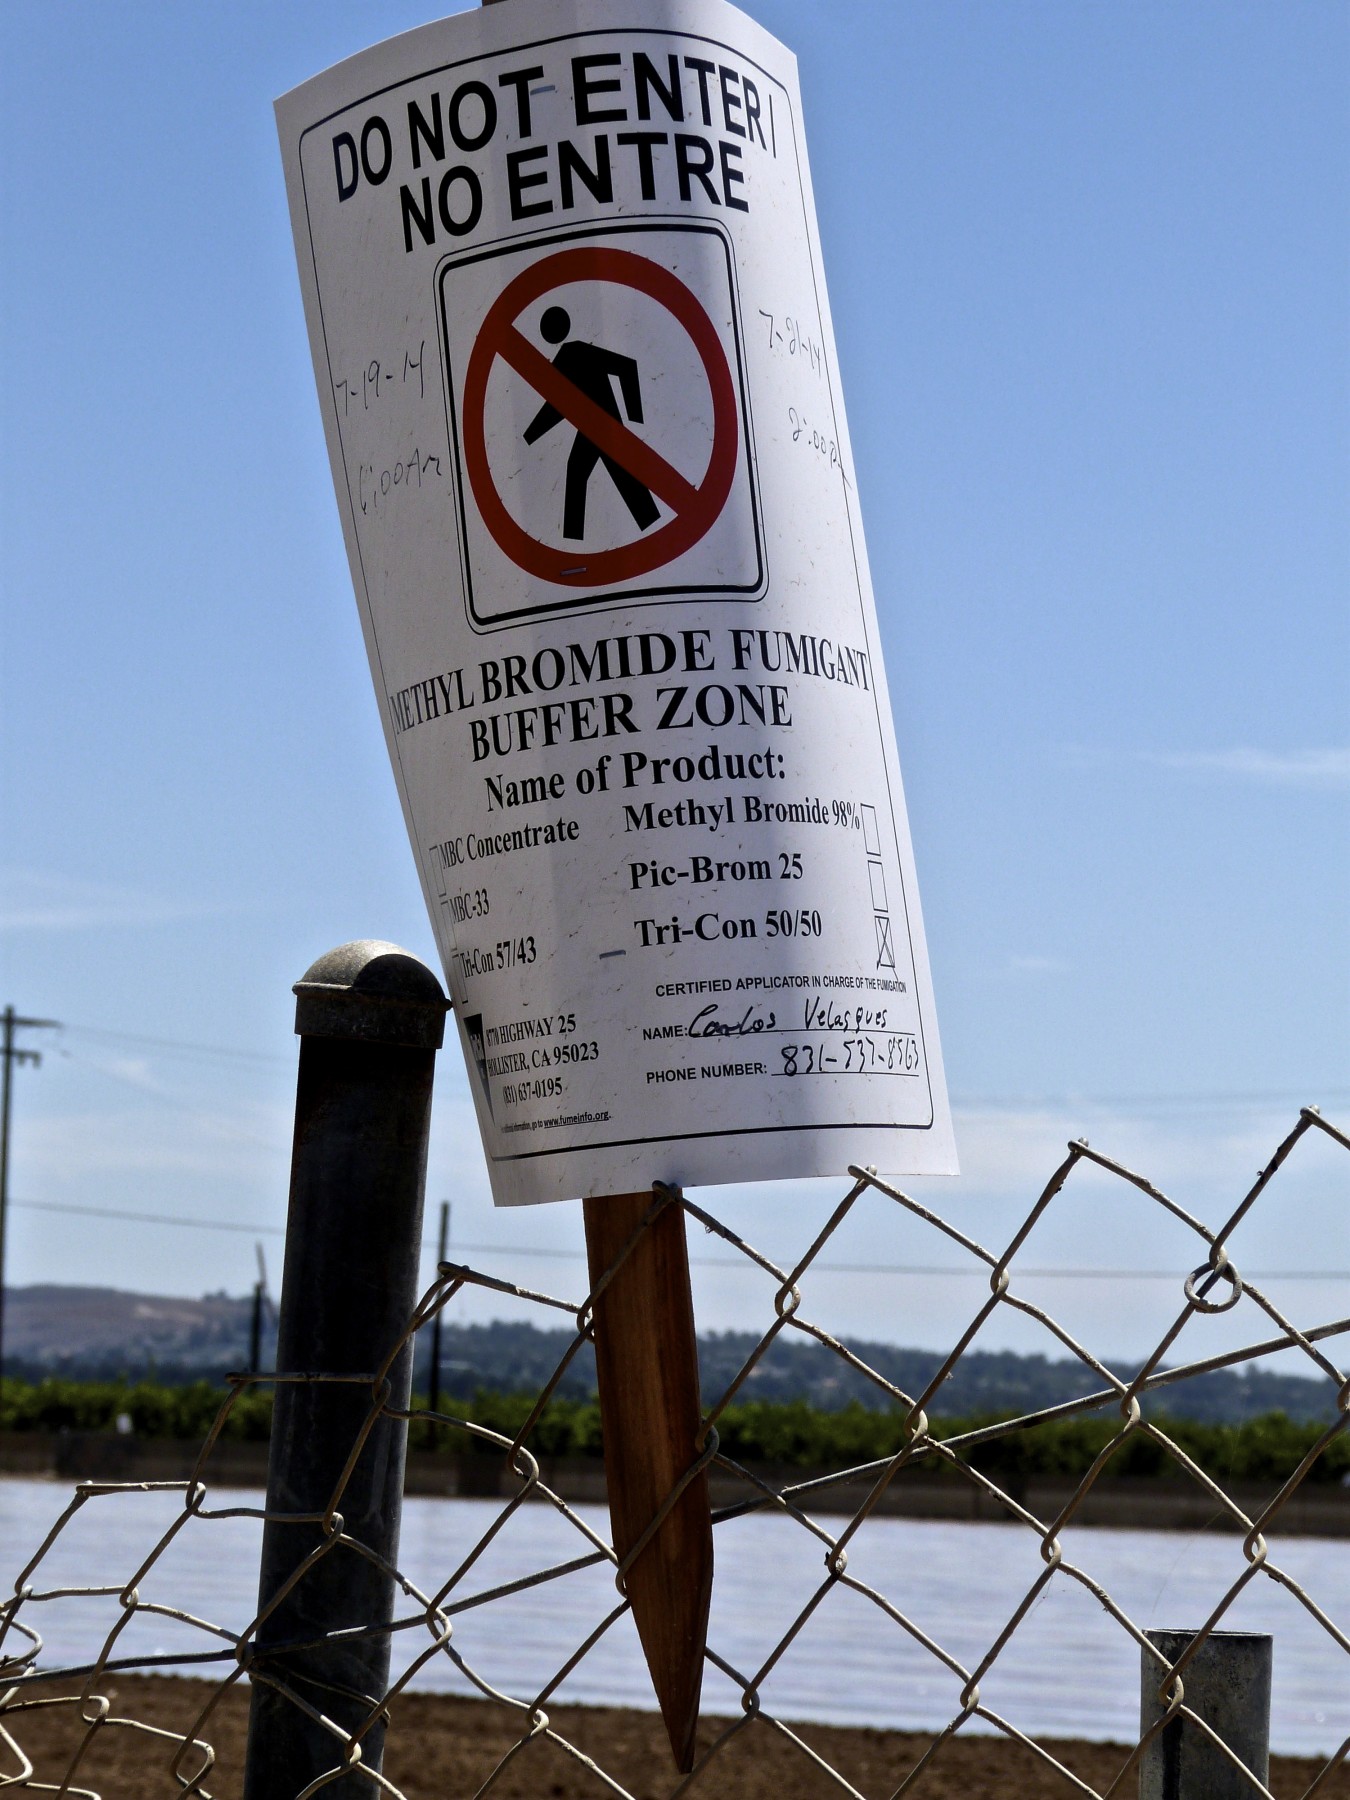
If you eat strawberries and live in the United States, there is a good chance that you’ve had strawberries grown in Oxnard, California. Each year, Oxnard and the surrounding Ventura County grow more than 630 million pounds of strawberries—a crop that uses high levels of pesticides, including fumigants, which are among the most toxic.
Writer Liza Gross, a part-time senior editor at PLOS Biology and blogger for KQED Science, Northern California’s public media outlet, spent months sifting through California’s pesticide data to find out how pesticide use was changing around the state. Her feature, “Fields of Toxic Pesticides Surround the Schools of Ventura,” published in The Nation on April 6, 2015, found that even though pesticide use has dropped in some communities over the years, there has been a dramatic rise in use in other communities, including Oxnard, which has a large Latino population and several schools that rest within a quarter mile of the most heavily treated areas in the state. State pesticide regulators say there is nothing to be concerned about.
Here, Gross tells Hannah Hoag the story behind the story. (This interview has been edited for length and clarity.)
Where did you get the idea for this piece?
This story was a follow-on to another I’d done, looking at environmental health disparities among minority groups and access to safe drinking water in California. A report out of the University of California, Davis, had looked at decades of nitrate contamination of ground water in California and tied it to agriculture production. This report made it very clear that more than 95 percent of the nitrate pollution was coming from agriculture. But then regulators didn’t do anything about it.
I had been thinking, “How do you actually get regulators to do anything about these disparities?” Maybe there is a way to show how bad it has been over time in specific communities. That might be a way to really shine a light on the problem. Often the regulators are the ones that are failing to protect public health.
I had originally thought I would do something that showed the cumulative impacts—water quality, air quality, and pesticide exposure—and match that to health outcomes. But I ran into problems. How was I going to figure out whether people had been exposed? It would all be correlation. The bigger problem was that many of these towns were tiny and I couldn’t get access to health data because of confidentiality rules.
The environmental health screening tool CalEnviroScreen looks at pollution exposure over a couple of years and a subset of health impacts by zip code. I decided I was going to use that as a starting point to look at 66 of the most hazardous pesticides, and to look at their use over a longer time scale to see which communities had been most impacted. I chose these 66 because regulators identified them as the most likely to drift and cause harm.
You needed a lot of data and the skills to organize the data and analyze it. How did you prepare for reporting this story? Were there sites or organizations that helped you?
In 2011, I did a two-week training course at the New England Center for Investigative Reporting (NECIR) with Joe Bergantino, who broke the Catholic priest sex-abuse story wide open in the 1990s, and computer-assisted reporting wizard Maggie Mulvihill. They provided me with an invaluable framework for doing investigative reporting, including the seemingly obvious but invaluable tip to make sure you don’t get lost in a mountain of material: Stick to a central question and ask yourself who’s benefiting and who isn’t. The corollary to that is always question your assumptions. Every new piece of info should serve to test your assumptions, which could be wrong and lead you astray.
I’m also a member of Investigative Reporters and Editors (IRE), which has a database of tip sheets to help you investigate any number of topics, and tutorials on using Excel and Access to manage your data. My NECIR training came with a copy of IRE’s Computer-Assisted Reporting: A Practical Guide, which I recommend to anyone interested in this type of reporting. And my friend and colleague Peter Aldhous offers invaluable free advice and resources on his website, to help you get started in data reporting.
For this story, I called people I knew who worked with this kind of data and I asked them for help. They pointed me to these wonderful web-based browsers. The California Department of Public Health—their Environmental Health Investigations Branch—and the Department of Pesticide Regulation (DPR) have tools that allow you to look at particular pesticides at particular times in particular geography.

Did you use any other online reporting tools to get the data, such as web scraping, FOIA requests, and so on?
In California, a lot of the time, if you just ask for the data, they’ll give it to you and you don’t have to go through a formal public-record request. I asked the California Department of Public Health for the underlying data for their “Agricultural Pesticide Use Near Public Schools” report. I also requested data from the Ventura County Agricultural Commissioner’s office to make sure that what I was getting was in keeping with what they had. And I filed a Legislative Open Records Act request for Senator Cathleen Galgiani, who sits on the [state] senate’s agricultural committee, and a California Public Records Act request for Henry Gonzales, the agricultural commissioner.
You have to make sure your request is as explicit as possible, but not too big, or they’ll just say, “We’re not going to respond to this.” The exact wording was: “I’m requesting copies of any and all communications between your office and other parties, both within and outside government, regarding the California Department of Public Health’s ‘Agricultural Pesticide Use Near Public Schools in California’ report, between January 1, 2013, and May 1, 2014.”
I got most of the material I requested within a week. Some data, including health data, I never got because of confidentiality restrictions. Gonzales and Galgiani responded to me and gave me documents in response to my request within a few weeks. But they didn’t give me correspondence and drafts that they claimed were exempt from disclosure, citing the appropriate code.
What were some of the technical challenges you faced in doing this story?
I’ve learned an enormous amount working on this story.
One challenge came up immediately in looking at the data. The geography is coded in something called the Public Land Survey System, which is the Bureau of Land Management’s arcane geography-coding unit that has nothing to do with where people live. The BLM manages land, not people, and its system dates back to the 1780s. Most of the land in the U.S. has been surveyed as 36-square-mile “townships.” I realized that even if I got all this data, and saw which of these little geographic units were most affected, I wouldn’t know where they were. I needed to work with a GIS specialist. I asked Jonathan London, an environmental justice and policy expert at the Center for Regional Change at UC Davis, if he could help map this data by zip code. He was really supportive and he was incredibly generous in offering his staff to help me.
Most people who work with the pesticide-use reporting databases on a regular basis get the data in big batches directly from colleagues they know at the agency. The data is readily available, either through informal channels or on the agency’s website through zip files. I don’t have the database software or programming acumen to manage such big batches, so I worked with the zipped .txt files.
I had to use Access, a database management system, and Excel, which allows you to manipulate data in a worksheet. Access limits how much data you can handle in one table, so I put the original data into Excel. I couldn’t import 58 .txt files (for the 58 counties in California) into Excel all at once so I looked for ways to make that task somewhat more tractable. I found an Excel add-on called Power Query that allowed me to import multiple text files at a time into Excel. Then I imported batches of Excel spreadsheets into Access so that I could strip out the fields I didn’t need and filter out all the pesticides except for the 66 I had decided to focus on. [Editors’ note: Here’s a handy list of Excel shortcuts.] Once I had the data reduced to just the fields I wanted to analyze, I exported the Access tables back into Excel and sent them to Jonathan London’s staff to map the PLSS code by zip code.
I also imported my Excel files into Tableau, a data-visualization program, to visualize the data to help me get a better grasp of the larger trends.
I ran into several challenges along the way, because the pesticide-use data is messy, and not consistent over the years. So I had to revise my data-processing steps depending on what year I was working with.
Do you have any other tips?
One easy tip that I discovered the hard way is to keep a data diary. You’d be amazed how quickly you forget why you gave a spreadsheet a particular name, even though at the time it seemed blazingly obvious. Forgetting what a spreadsheet contains isn’t a big deal when you’re processing a handful of files. But when you’re dealing with hundreds of spreadsheets, having a diary to refer to can be a huge timesaver.
Whenever you download data, note the source, date, intended use, and any data-processing steps. Also make a note of corresponding metadata dictionaries and lookup tables that go with the data. Metadata dictionaries tell you what the code in each field means. DPR produces a 98-page manual for using its pesticide data. The field headers in big datasets are typically coded, so you need a lookup table to find out what the code means—for example, to match the name of the pesticide with its code in your spreadsheet.
Also, a lot of the pesticide reports from DPR are in PDF form, which doesn’t help if you want to analyze, sort the data, or calculate totals of pesticides applied. So I had to convert a lot of docs into Excel or Word to make them searchable, which I did by simply saving the PDF as Excel or Word. You can also choose “recognize text” under Tools. This requires Adobe Acrobat Pro, which is worthwhile if you do a lot of this work.
Once you had the data in hand, did you worry about whether or not you’d actually have a story after you had sorted through it?
I often worried whether I would have a story at the end of it. I didn’t know until the data came back from my GIS expert what it would tell me. I had to hold out faith that it was going to be important, no matter what exactly it told me, to see where, or if, these toxic chemicals were concentrating over time.
Eventually, I saw—wow!—a hotbed in this place Oxnard, which I hadn’t thought about before. Everyone was telling me to focus on the Central Valley, which definitely has more pesticide use than any other county in California, but those are not filtered by hazard. It’s not to say that the Central Valley is not heavily impacted by pesticides, it just shows you how much worse it is in Oxnard. Then I did a little more investigating, because it was ringing a bell.
Oxnard is at the center of a Title VI civil rights complaint. [In 1999, six parents filed a complaint with the Environmental Protection Agency (EPA), charging that state regulators had violated federal discrimination laws by approving permits for pesticides near their children’s schools, which were primarily attended by children of color, mostly Latino.] Title VI prohibits recipients of federal funding from discriminating based on race, color, or national origin. It’s all about demonstrating disparate impact: that there is an adverse impact and a minority that is disproportionately affected.
I realized it was a much bigger story than I had thought. The complaint showed that the regulators already knew about the problem. But then, after they settled it, they said it was no longer a problem. After the California pesticides-near-schools report came out, the regulators all said that proximity didn’t equal exposure. It was an industry talking point. All the people who study pesticide exposures and their potential health effects use proximity as a proxy for exposure.
That’s when I realized that all my hard work had paid off. This original Title VI complaint and the EPA’s own analysis showed these families were disproportionately impacted, but the complaint was in appeals and going nowhere. Now I actually had the data to show that it had gotten worse after the regulatory agencies said everything’s fine.
You had support from different reporting grants and from the Food and Environment Reporting Network (FERN)—how did they help?
I got very generous funding from the NYU Reporting Award and USC Annenberg’s Dennis A. Hunt Fund for Health Journalism, which added up to $10,500. They were both incredibly patient while I kept telling them that I was running into roadblocks with the reporting.
I ran into a hiccup where I thought the story would run in one outlet and it didn’t work out. I spoke to a few places that I knew supported investigative reporting and I found that the Food and Environmental Reporting Network was very responsive to the reporting I had done. What is so wonderful about that outfit is that they supplement the fees that writers get so that it raises it up to more of a living wage. I was very grateful to have their support. They approached The Nation, which was very interested in the story.
How long did this take from start to finish?
It took close to a year and a half to overcome all the challenges with working with the data, doing all the on-the-ground reporting and phone interviews, the public-records requests, and finding the appropriate outlet.
Were there other reporting and writing challenges you faced?
One of the biggest challenges—and frustrations—was that the family members involved in the Title VI complaint would not talk to me (or any other reporter), so I struggled with how to tell the story. I had to figure out a way to make that kind of an interesting aspect of the story. They were, after all that time, still worried about retribution.

I researched old news stories on the case and anything I could find to get insight into the history. I got a ton of documents from the attorneys at the Center on Race, Poverty & the Environment, including the original complaint, appeals, new filings, decisions, etc. You can also use PACER to access some of these court documents and see the history of the legal action. It’s not at all intuitive, but there’s a handy tool to help.
One challenge of reporting in Latino communities is the language barrier. I did some interviews with farm hands who speak Mixteco, an indigenous Mexican language, so I needed interpreters. I also had a few Spanish-language interpreters.
What sort of response have you had to the story?
Researchers were blown away with the situation. Some of the health researchers didn’t realize that Oxnard had been the site of this lawsuit where people realized they were dealing with this heavy exposure and nothing had been done. I’ve heard from activists who are handing [the story] out to every funder they can think of. At the end of April, after the story appeared, I was asked to talk to legislators and their staffers at a legislative briefing for upcoming workshops on how to deal with the issue of pesticide use near schools.
It’s quite an accomplishment.
Yes, and also, you know, I’m a little bit humbled. I don’t know what it actually takes to force change when something so obviously unfair and that dangerous has happened. I hope this is a small measure to correcting a situation that should have been changed many years ago.
Were you worried about liability issues?
Fear is a good motivator for being a good reporter. I can’t tell you the number of times I sat up in the middle of the night thinking, “Oh my god, what if I got this wrong?” I was maniacal about fact-checking, and thank god The Nation has a really good fact-checking department. I checked my methods with researchers and verified my data independently, and did quality checks a lot.
You’re a freelancer and yet you invested a huge amount of time and energy into reporting this story, even though the payoff was uncertain. Would you recommend other freelancers take on investigative stories?
Hell no!
But you’re going to do it again, aren’t you?
I will probably do it again, but my husband has asked me to start writing about big cats again, something I used to be obsessed with.
Seriously, this is the sort of thing that you can easily fall down a rabbit hole doing. While I was still trying to get the story after most of the reporting had been done, the Center for Investigative Reporting, with an entire team, came out with a similar story. The scope of the investigation was really better suited to a team of reporters. But there are smaller-scale stories that you can do using many of the same tools I used.
I would definitely recommend that people start using the tools that are out there. There are so many stories hidden in data, you just have to start looking for them.
Hannah Hoag is a science journalist and editor based in Toronto. Her work has been published in Nature, Discover, Wired, Maclean’s, The Globe and Mail, and elsewhere. Follow her on twitter @hannahh.